
This blog post has been pending for the past 3 or 4 months, but with today’s implosion in Yes Bank it’s a good time to discuss…financial markets and charts.
Chart 1: Nikkei
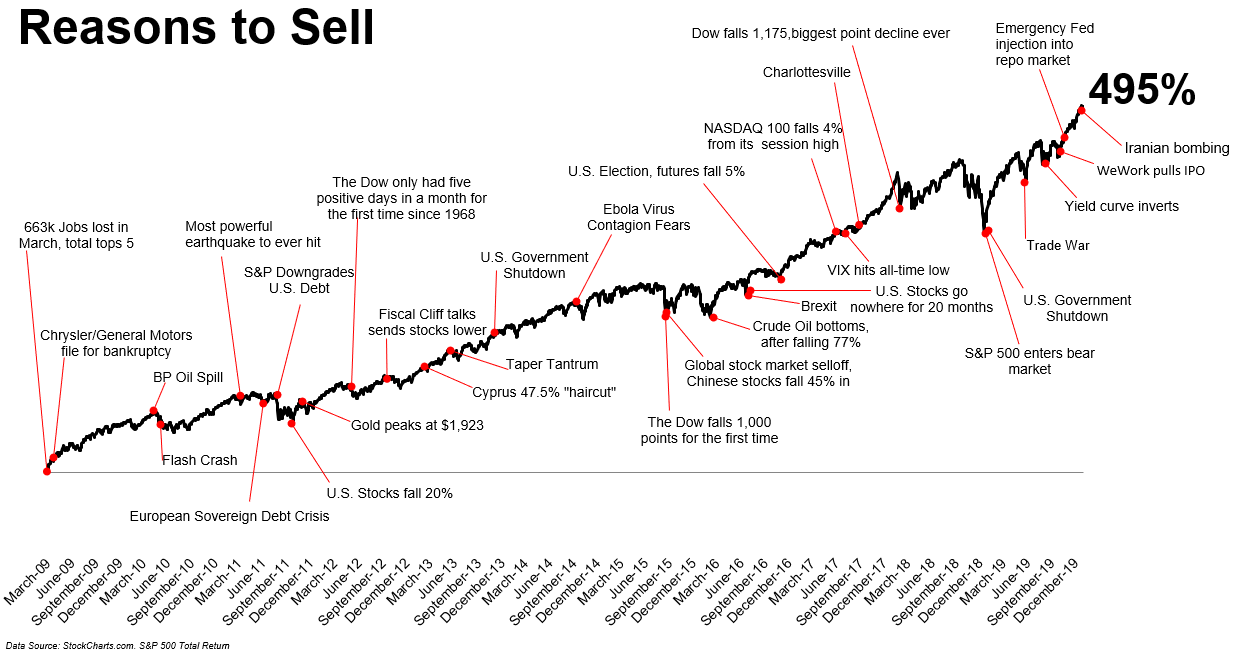
I’m not sure who posted the following chart on Twitter, in essence it’s always a good time to buy. When you see this chart, it does make sense that even if you bought on the day the Dow dropped 1,000 points you still would be doing well. Problem is that we are in a 11 year bull run and everything looks awesome. I’m sure value investors and Warren Buffet have some catchy phrase for that!
On the flipside, I present the following chart of Japan’s Nikkei index level. If you look closely, the market hit a peak on Dec. 29, 1989 and finished the year at an all-time high of 38,916. It has NEVER returned to those levels. As of March 5, 2020 it’s trading at 20,750.
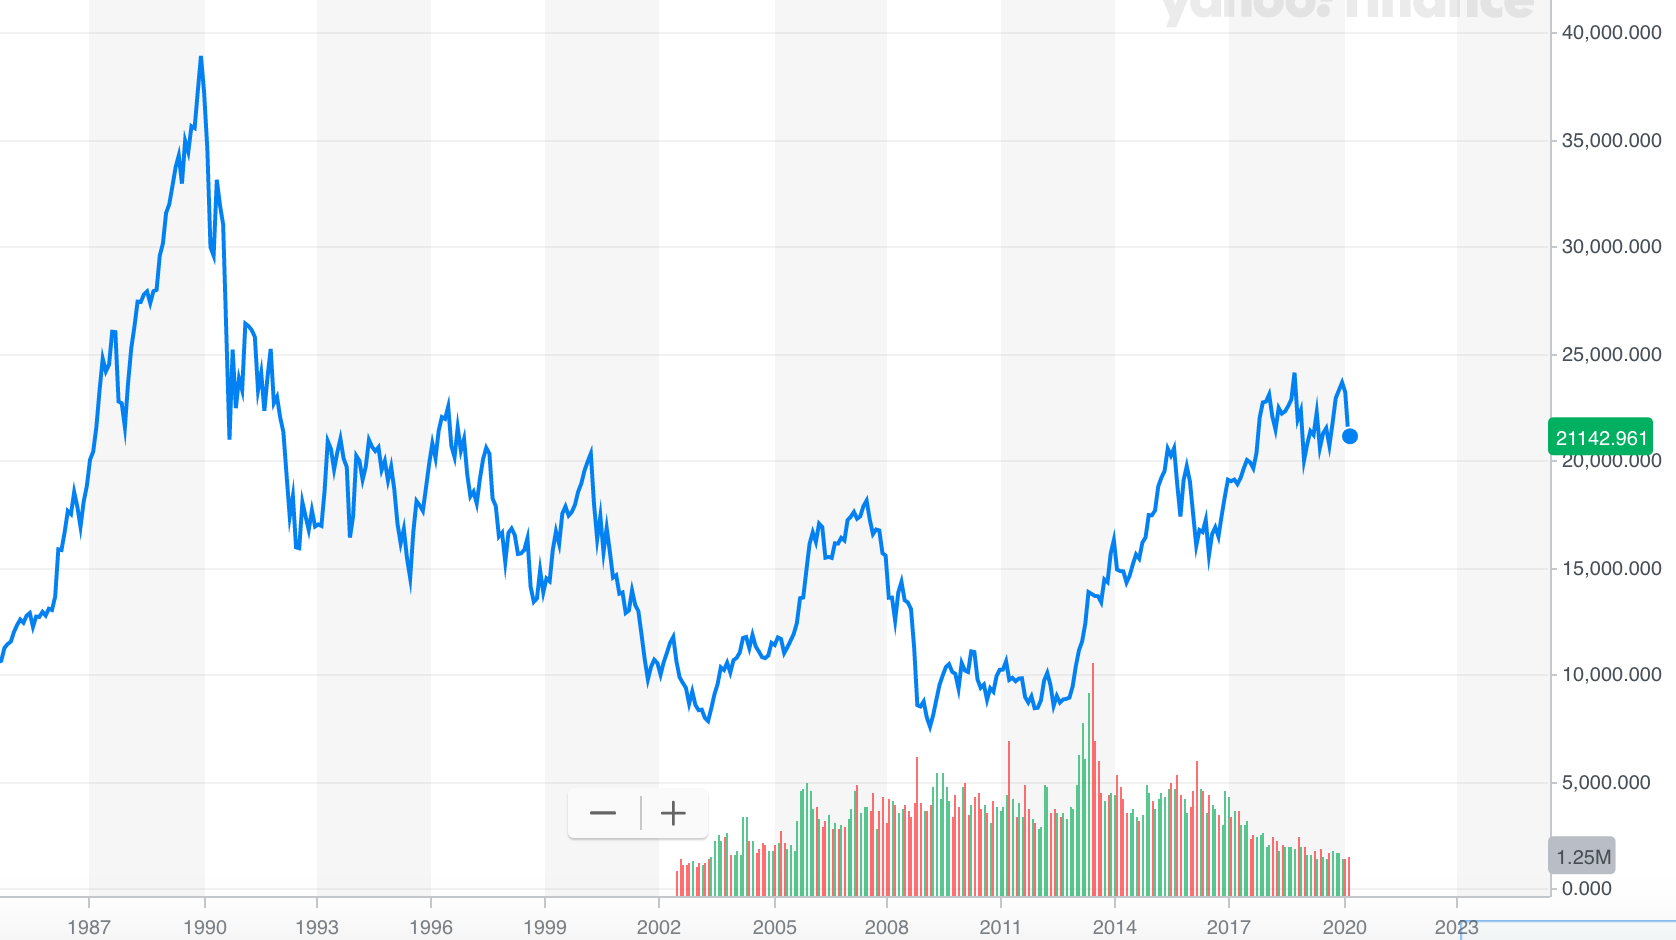
Summary: Not everything goes up forever.
Chart 2: NYC Medallions
Remember when Uber launched in NYC and everyone said that the yellow taxis would die. And since the taxis would die, the price of their medallions would crash.
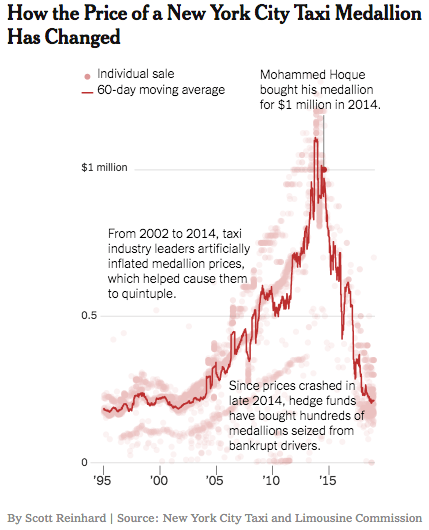
Guess what? That never happened. Instead the prices hit historical highs even though Uber was all over NYC. What was reason? Subprime lending to taxi medallion owners who mainly were immigrants. When the bottom finally felt out, the market for medallions crashed.
Summary: You never really know what’s happening under the hood of many things.
Chart 3: 2014 US Elections
Ugh…even the experts don’t know. In the days leading up to the election, everyone said that there is NO WAY that Trump would win. Well…
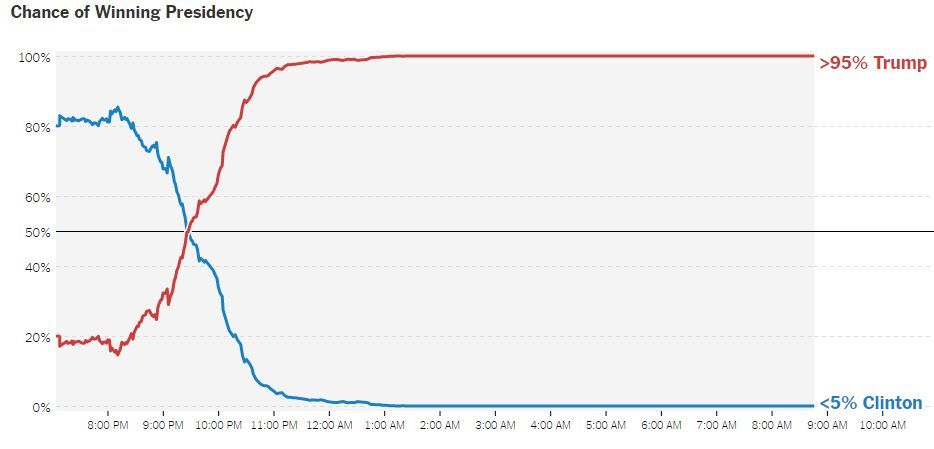
Summary: Black swan.
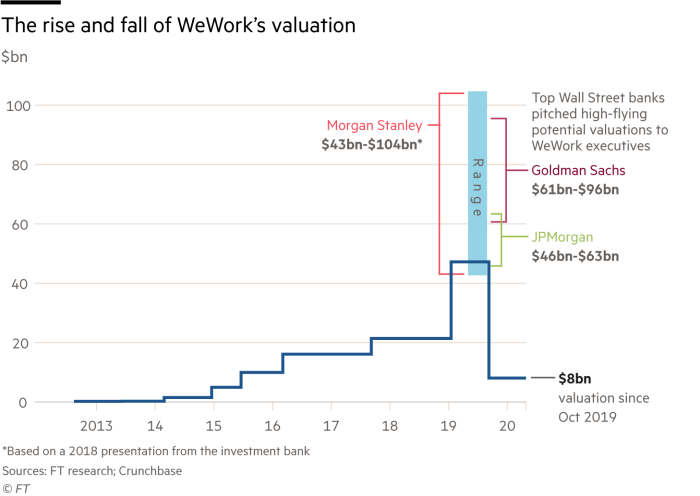
Bonus Chart: WeWork
I just came across the WeWork valuation chart. Look at the valuation estimates from Morgan, Goldman and JPMorgan…they all were going to be part of the IPO offer and were incentivized to ratchet up the price.
Summary: It pays to have a good business model.
Well there you have it, the 4 charts that I look at from time to time when I think I know everything. These 4 bring me back down to earth.
